Charting and Graphing
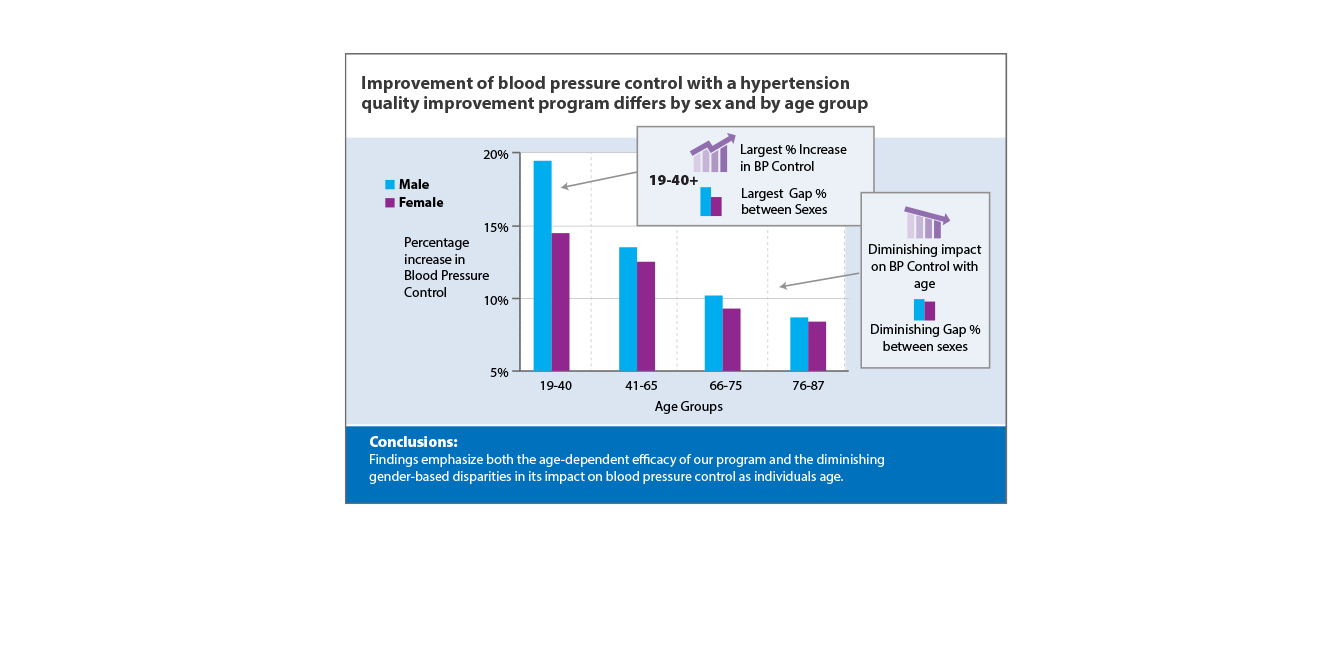
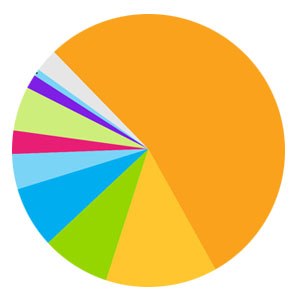
I specialize in creating compelling information graphics using common graphing methods such as pie charts, area charts, and other visual formats. For over 25 years, I have transformed raw, supplied data points into visually engaging charts that make complex or dry information more accessible and appealing to viewers. By presenting data in a clear and visually interesting way, I help audiences better understand key insights, turning numbers and statistics into impactful visual stories.


