About Me 614-578-9905
Tom Mattix: email
I am a seasoned information graphics and infographic designer with over 25 years of experience, blending art, data, and storytelling to create compelling visual narratives. My journey in design began with my formal education at the Columbus College of Art and Design, where I earned my BFA in 1997. Along the way, I had the privilege of studying with acclaimed infographic expert Nigel Holmes during a workshop at the Rhode Island School of Design in 1992. These experiences laid the foundation for a career focused on transforming complex information into accessible, visually engaging graphics.
Throughout my career, I have worked across a wide range of industries, creating specialized infographics, breakaway drawings, and visual representations for health care, engineering, geo-textiles, and more. My work spans the following areas:
Health Care Graphics
In the health care sector, I have collaborated with institutions such as the National Kidney Foundation, Loyola University Medical Center, and Ohio State University Medical Center. My role is to create visual representations of complex medical processes and terminology. From grant application materials to journal publications and patient-education visuals, my work helps medical professionals communicate their research and findings in a way that is clear and accessible.
Engineering and Technology Graphics
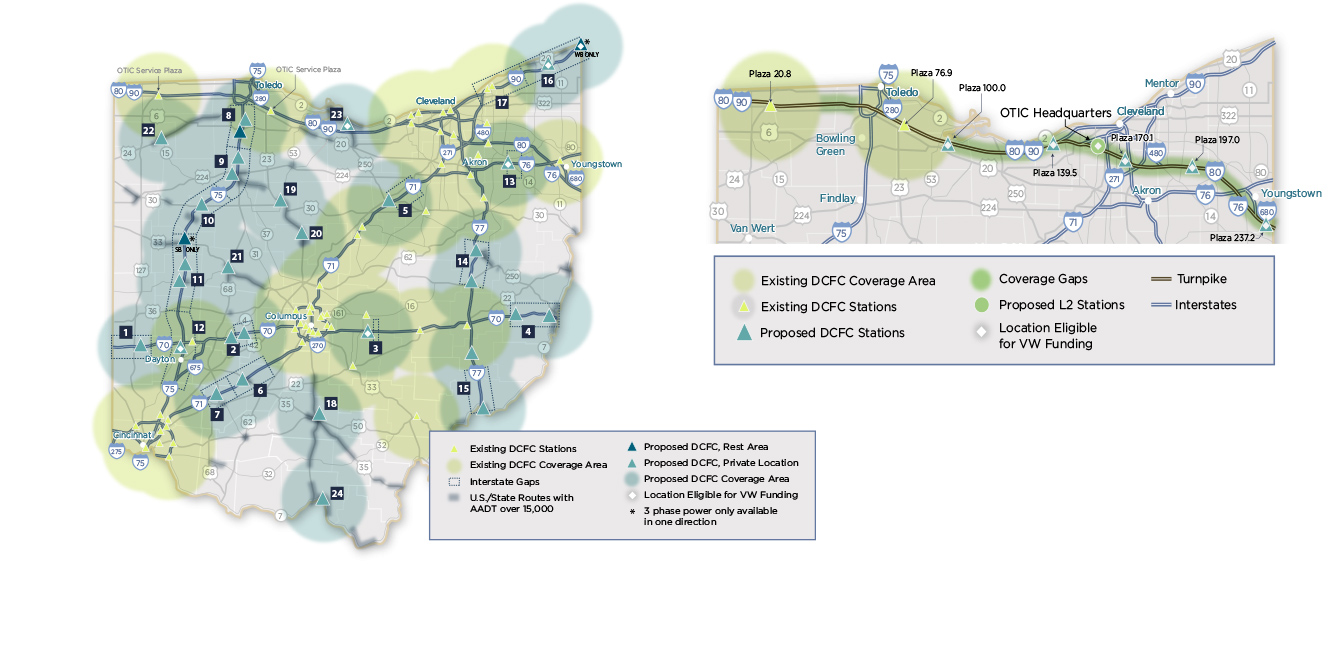
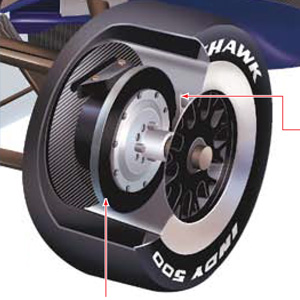
My experience includes designing infographics for infrastructure and technology projects. I’ve worked with companies like HNTB Corp., Mettler Toledo, and the City of Columbus, Ohio, to create visuals that explain processes behind major engineering projects, including highways, tollways, and cutting-edge technologies like electric vehicle (EV) systems and eVTOL aircraft. These graphics help to break down the technical details into digestible visual elements.
Geo-Synthetics and Geo-Textiles
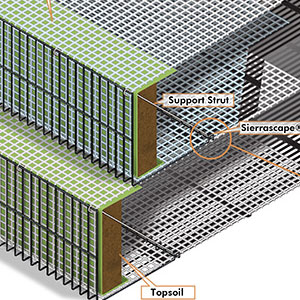
In the geo-synthetics and geo-textile industries, I have worked with companies like Tencate and Tensar Corp. to create graphics that explain their products, including those used for roadway stabilization, soil erosion control, and foundation support for large-scale construction projects. Through breakaway drawings and process illustrations, I clarify how these essential products function, helping customers and engineers understand the value and application of these systems.
Icon and Logo Design
My expertise extends to vector-based icon design, where I craft clear and effective icons to help communicate processes and ideas. These icons play a crucial role in simplifying complex systems and are often used in manuals, websites, and infographics. I’ve also designed logos for a wide variety of industries, from health care organizations to local governments, including clients like Zoo Atlanta and the Columbus Zoo.
Manuals and Instructional Graphics
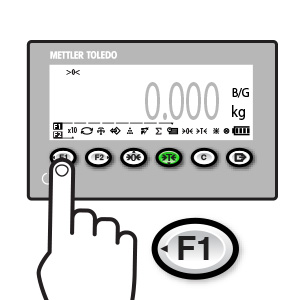
I specialize in creating instructional graphics that convey processes with minimal text, ensuring that the visuals are universally understood across different languages and regions. Companies marketing their products globally rely on my ability to create clear and concise manuals, rich with graphic illustrations and icons. My technical illustrations are developed using software such as Strata and Cheetah 3D, providing detailed, visually accurate representations of processes.
Charting and Graphing
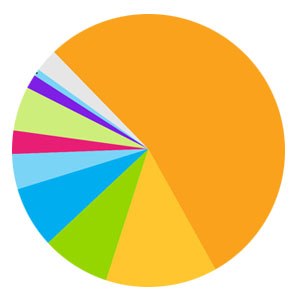
For over two decades, I have been transforming raw data into visually engaging charts and graphs. Using pie charts, area charts, and other methods, I bring dry numbers to life, making information more accessible and visually appealing. Whether for financial reports, research papers, or editorial content, I help audiences better understand data and its implications through thoughtful, clear charting.
Editorial Informational Graphics
I spent eight years at the Columbus Dispatch newspaper, creating editorial infographics that accompanied published articles. My work provided visual context to complex stories, helping readers engage with the content in a more meaningful way. This experience sharpened my ability to translate complex information into visuals that are not only informative but also visually captivating. Examples of this work can be found in my portfolio, under editorial spot and story illustration.
Motion Graphics
In addition to static graphics, I also develop motion graphics, using video and vector graphics to explain technical processes through animated visuals. These motion graphics are designed to break down complex procedures in a dynamic, engaging way, perfect for training materials, product demonstrations, and more.
Awards and Honors
My work has been recognized with numerous awards, including accolades from the Society of Newspaper Design (SND), the Associated Press of Ohio, and the Central Ohio Newspaper Guild. Notable awards include the 2007 SND award of merit, several first-place awards for page illustration, and a 1988 "Best of Show" from the Fort Wayne Art Association.
From health care to engineering, from logos to instructional materials, my goal is to make complex information understandable and engaging through visually striking graphics. If you’re looking for a designer who can bring clarity to complexity, I’d love to collaborate.


